We knew he was a bore and boor. Now we have learned that Donald Trump is an honorary Boer. When he turned his attention to South Africa on Wednesday, it may come as no surprise that the US president – who has been sued for discriminating against Black apartment seekers, called for the death penalty for the Central Park Five, pushed the false claim that Barack Obama was born in Kenya, referred to Haiti and African nations as “shithole countries”, and blamed an air crash on DEI – was rooting for the whites.
David Smith in The Guardian, Wed 21 May 2025 23.25 BST
In the previous post What is Trumpism? Part 1- The Root of the Problem, I set out a a framework to understand the causes of the Trump phenomenon. These are rooted in the declining global power of Western imperialism of which the US has been the uncontested leader.
In the subsequent post, What is Trumpism? Part 2- The Old, the New Working Class and National Identity, I used the results of the 2024 US presidential elections to identify the possible social base which could lead a fight back against Trumpism. I called this the new working class, the most important characteristic of which is its multiethnicity and multiculturalism which makes it inherently impervious to Trump’s nationalist and white supremacist hidden agenda.
This post is appearing much later than I intended, mainly because it has required a great deal more research than I first envisaged. The investigation has answered some questions, but also raised new ones which I will try to address in a further post.
The research has convinced me that racism is the most potent weapon in Trump’s armoury. He is using it to mobilise white America against the world. The racist streak that has permeated the identity of this great nation from its inception, has been instrumentalised to great effect by implicitly blaming the racial other for the global demise of America.
In this post, I have tried, through a geographic and demographic analysis of the Trump vote in the areas where it is most concentrated, to identify the social basis of Trumpism, and the role that race and class play in his appeal. In a subsequent post, I will examine historically the processes that led many of the descendants of the industrial working class, victims of the dynamics of capitalism, to embrace Trumpism.
Who are the True Americans?
Before I started this research, I was unaware of quite how deeply United States national identity was permeated by the issue of race. This is probably because that identity has been generally taken for granted and not questioned by the mainstream American establishment and its main media outlets, or by US’s Western imperial partners. Trump’s “Make America Great Again” and “America First” agendas placed the issue of identity at the centre of politics, and highlighted race.
The True Americans who are meant to benefit from the policies designed to implement the slogans, to the exclusion of all others, are those who adhere to the symbolic meaning that has been traditionally given to the Stars and Stripes and which projects the greatness of America to the rest of the world. Immigrants, by definition, are outsiders.
The problem, however, is that most current immigrants come from the same countries that previous immigrants, now well settled citizens of the United States, came from. The label Hispanic can be applied equally to a large number of US citizens and to recent immigrants from Latin America, legal or undocumented, who have not yet acquired US citizenship. Implicitly, all Hispanics become outsiders. This creates a split in the US Hispanics community’s relationship to the nation. Electoral pundits have pointed out that in the recent elections, many of the better-off Hispanics have tried to save themselves by rallying to the Stars and Stripes and to Trump’s anti-immigrant agenda.
But there is little Hispanic, or Black identity carried by the Stars and Stripes. Ultimately, the Stars and Stripes symbolises White America and it is White America that is being rallied by Trump. I will demonstrate this by the subsequent analysis of the electoral results. The strongest indicator of electoral support for Trump is the degree of whiteness of the electorate.1
Detailed analysis of the results and of the racial composition of the electors shows that the whiter the county’s population is, the more likely it is to vote solidly for Trump.
White population and Trump vote correlate
I have calculated the correlation coefficient between the proportion of the vote obtained by Trump in the 2024 US presidential election in each county and the proportion of the county’s population that is classified as “Not Hispanic, White alone” for every state of the union, bar the peripheral states of Alaska and Hawaii, and Delaware which has too few counties to make the correlation meaningful. The results not only largely support my thesis but also give interesting insights into the historically created regional identities.
The correlation coefficient between the percentage of the county’s population classified as non-Hispanic white and the % vote for Trump for every county of the United States, bar the excluded states, is 43%. This indicates only a moderate positive correlation. However, the regional variations are large and very interesting. The following groups of states have very high correlation coefficients.
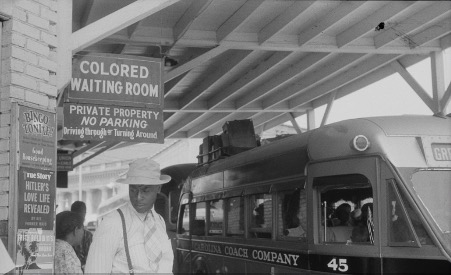
Former Jim Crow States
Segregation at the bus station in Durham, North Carolina in 1940.
Fig.2 below is a map of the US showing in red the states where racial segregation in education was legally compulsory and enforced until, in 1954, the US Supreme Court found that legally mandated public school segregation was unconstitutional, as the result of a case brought before it Known as the Brown v. Board of Education of Topeka case.
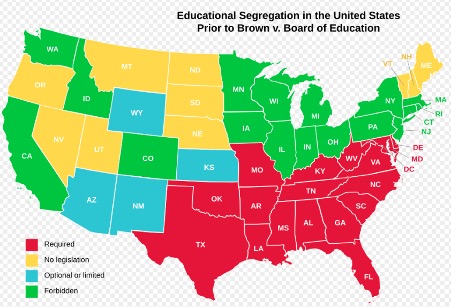
Fig.1: Map of Jim Crow states (in red)
Source: https://en.wikipedia.org/wiki/Jim_Crow_laws
The following table shows the correlation between the proportion of the population who are white and the Trump vote in the states shown in red on the map. The extremely high level of correlation is remarkable and demonstrates the extent to which racism still plays an important part of people’s identities. The anomalous figure for Oklahoma deserves further investigation. This is beyond the scope of this post.
| Correlation between % of the population who are non-Hispanic white and % vote for Trump | 2024 % vote for Trump | 2024 % vote for Harris | |
| Alabama | 97% | 65% | 34% |
| Mississipi | 96% | 61% | 38% |
| Louisiana | 93% | 60% | 38% |
| South Carolina | 89% | 58% | 40% |
| Georgia | 88% | 51% | 49% |
| Arkansas | 85% | 64% | 34% |
| Tennessee | 84% | 64% | 34% |
| Virginia | 78% | 46% | 52% |
| Kentucky | 70% | 65% | 34% |
| North Carolina | 66% | 51% | 48% |
| Texas | 65% | 56% | 42% |
| Florida | 63% | 56% | 43% |
| West Virginia | 56% | 70% | 28% |
| Oklahoma | 38% | 66% | 32% |
Table 1: Correlation of Trump vote with proportion of White population
Left Behind- geography and class
One of the most ubiquitous concepts that is used in mainstream media to explain the vote for right-wing populism in a large number of countries is the feeling that voters have of having been of being “left behind”. This is often associated with people living in areas such as the Rust Belt of the United States and the Red Wall districts of the UK, where industry used to be located but are now deindustrialised. The inhabitants are referred to to as the “white working class”. But it also applies more generally to the populations living in declining peripheral rural areas.
I am not aware of academics having made a serious attempt to theorise the material basis for this feeling. I have been trying to do this in previous posts in this blog by identifying the locations where the far right have achieved a particularly high vote in elections since 2016 in different countries and trying to characterize the material circumstances in those areas which might give rise for such feelings. The general hypothesis that I have put forward is as follows:
1. Capitalist economic development tends to gradually concentrate geographically economic activity into particular areas which also become the main centres of economic growth. The process of a growing urbanisation of the country is part of this process. Growth is concentrated in major metropoles.
2. In periods of strong economic growth, although the engine of growth lies primarily in already prosperous areas, some growth, albeit at a smaller rate, trickles down to peripheral areas. This leaves their populations feeling that things are getting better for them to.2
In periods of strong growth, in the recipient areas of immigration, growth was strong enough to maintain the bargaining power of native workers despite the competition from immigrant workers. The resulting tensions between native and immigrant workers were kept under control and there were increasingly cases of them making common cause. Struggles such as the Grunwicks strike or the Garners Steakhouses strike, in which I was involved in the UK, were examples.
The shift of the engine of world economic growth, beginning in the 1970s from the West, led by the US, to Japan and East Asia, eventually centred in China, and accompanying deindustrialisation of the West, created very different conditions. Whilst world growth was sufficient to trickle down from its Asian epicentre to the West, the tensions were kept in check. The Great Recession of 2007/9, and subsequent stagnation, left significant areas of Western countries going backwards economically, whilst the main metropolitan areas continued to experience some growth. This, I would argue, is what provokes the feeling of their peripheral populations that they are being “left behind”. This strengthens regional identities across classes and being left behind is how they feel in relation to the nation as a whole. Demands for devolution and separatism follow.
I have applied these thoughts to try to understand the material circumstances that generate these feelings in the areas where the far right has had particular success in various past elections (France, Spain, Portugal, Germany, UK). In the case of the 2024 US presidential elections, I have used the insights to examine the 10 counties with the highest percentage vote for Trump. In these counties, Trump obtained more that 90% of the vote. Six are in Texas, 4 in Nebraska, and one in Montana. They are all rural counties.
What all the counties have in common is that they are all rural and they are all losing population, mirroring what I have found for all the other examples in different countries I have studied in previous posts.
| State | County | Trump vote as % of total | Population change from 2010 to 2020 |
| Texas | Roberts County | 96% | -7% |
| Nebraska | Grant County | 96% | -18% |
| Texas | Borden County | 96% | -18% |
| Texas | King County | 96% | -26% |
| Nebraska | Hayes County | 96% | -39% |
| Montana | Garfield County | 95% | -8% |
| Nebraska | McPherson County | 94% | -25% |
| Texas | Motley County | 94% | -25% |
| Texas | Glasscock County | 94% | -21% |
| Texas | Sherman County | 94% | -13% |
| Nebraska | Arthur County | 94% | -2% |
Table 2: Population change in the 10 counties with the highest Trump vote.
On average, the population of the 10 counties declined by 18% from 2000 to 2020.
Given what I said in the previous section about the importance of race identity and the correlation between the Trump vote and the proportion of the population which is White, I expected all these counties to be overwhelmingly White, but this isn’t entirely true. Three of the counties in Texas have significant Hispanic populations: Hansford (50% in 2023), Sherman (47% in 2023) and Glasscock (34% in 2023).

https://www.texastribune.org/2022/09/15/texas-demographics-census-2021
Hispanics in Texas, some of whom may have voted for Trump
Why people of Latin American origin should be voting for Trump in significant numbers is a question that I have not yet been able to answer.
The deindustrialised Rust Belt states- also left behind?
There has been a widespread view that the (descendants of?) white victims of deindustrialisation referred to as the white working class, even though they no longer contribute significantly to US economy, have constituted an important component of the Trump vote. I have investigated this issue statistically and through a more detailed case study of the Detroit region. The Detroit case study will be the subject of the next post.
The following is a table for the Rust Belt states which had been the cradle of US industrialisation and have been most affected by the recent deindustrialisation. The correlation coefficient has been calculated is with data at county level. This makes it a fairly reliable measure as each state has a large number of counties. The correlation for the Rust Belt states is much greater than the 43% for the US as a whole.
| Correlation between % of the population who are non-Hispanic white and % vote for Trump | 2024 % vote for Trump | 2024 % vote for Harris | |
| Ohio | 86% | 55% | 44% |
| Pennsylvania | 83% | 50% | 49% |
| Illinois | 80% | 44% | 55% |
| Indiana | 78% | 59% | 40% |
| Missouri | 74% | 59% | 40% |
| New York | 67% | 44% | 56% |
| Wisconsin | 65% | 50% | 49% |
| Michigan | 63% | 50% | 48% |
Table 3: Correlation for the Rust Belt states
What is noteworthy about this table denoting the high level of racial polarisation of the vote is not only the high correlation coefficient for these states, but also that it occurs even where Trump has lost the vote, such as New York state and Illinois.
Insofar as the white populations of the Rust Belt states still contain a high proportion of the descendants of the industrial working class who are popularly referred to as the white working class, these findings might suggest a strong racial component to their identities but, at this broad level of analysis, it is impossible to see this as anything more than circumstantial evidence.
Concluding remarks
As I developed this research, I became increasingly aware that race appeared to be an implicit component of US national identity3 that was shared by all classes, but excluded Afro-Americans, the descendants of slaves. They were the main victims of the empire that was rooted in Europe from where the white working class had come, and where the idea of race had originated. In seeking to Make America Great Again, Trump is mobilising politically this identity to try to reestablish the crumbling empire and the favourable economic base that enabled some benefits to accrue to the working class, and united the classes in their national identity, a historical process.
To investigate this further, I decided to carry out a historical case study of Detroit, MoTown, an archetypal industrial city of the US which has suffered particularly through deindustrialisation. This will be the subject of my next post.
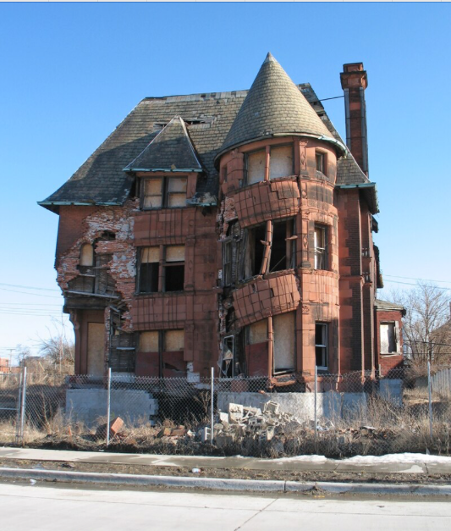
Left behind in Detroit
.jpg)
The William Livingstone house of 1893 was one of Albert Kahn’s first commissions. The first owner, Mr. Livingstone was president of the Lake Carriers Association for about 25 years; this organization pushed for improvements in shipping efficiency and safety. An art deco Lighthouse on Belle Isle was built to his memory and a ship navigation channel that was dredged near Boblo Island out to Lake Erie also bears his name. This picture taken in early March 2007 shows yet more damage to “slumpy” as it nears total collapse. Update: Less than a month after this photo was taken, most of the facade did collapse.
Alvaro de Miranda
Alvaro de Miranda is retired from the University of East London where he co-founded a Department of Innovation Studies. He came to the UK in 1958 aged 15 to join his parents who were exiles from the Salazar regime in Portugal. Having experienced fascism, he is particularly alarmed with the recent worldwide electoral rise of the far-right and has been following it comparatively in this blog.
It is interesting to note that the US census questionnaires give several different meanings to the racial label “white”. There is category titled “white alone” for individuals who identify as “White and only White”, excluding those who identify with multiple races or ethnicities. There is also a category “Not Hispanic, White alone” for individuals who identify as white and are not of Hispanic or Latino origin. These are almost exclusively those who are recent European immigrants to the US and the direct descendants of previous European immigrants. US residents who have Latin American ancestry but think of themselves as white will be counted under the “white alone” category, but not under “Not Hispanic, White Alone”. ↩
I arrived at this suggestion when thinking about possible reasons why rural areas of Portugal, particularly in the Alentejo, which have recently experienced population decline and ageing were now voting in large numbers for the far right (Reflections on the Recent Presidential Elections in Portugal and the Rise of the Far Right.). In the 1960s and 70s, this process was even more accentuated because of massive immigration of the younger population to Northern Europe. Yet, despite that, the left behind population were the core of resistance to the Salazar regime. Economic growth in Northern Europe in those decades was strong enough to have attracted large scale immigration from Portugal and other Southern European countries. Although such immigrants lived miserably in shanty towns, they survived psychologically on the belief that this was only a temporary existence for they were saving money to return home, hopefully soon. Their financial remittances to their families kept people back home feeling that things were getting better. At the same time, the exodus of the potential labour force, reducing the size of Marx’s “reserve army of labour”, in the areas from which they originated strengthened the bargaining power of the workers that remained. ↩
I don’t mean to imply by this that everyone who feels him or herself to be American is a racist, merely that the construction of the identity of the nation has been based on the a celebration and justification of its imperialist past which is necessarily racist. The current Trumpian struggle against wokeness is a struggle to regain the meaning of that identity that was being challenged by multicultural elements in the nation. ↩